


The Mandelbrot Set is one of the most famous fractals in mathematics, known for its infinitely complex and beautiful self-similar patterns. It is defined in the complex number plane and exhibits intricate, recursive structures. The boundary of the Mandelbrot set exhibits self-similarity and fractal-like structures.
How is the Mandelbrot Set defined?
The Mandelbrot set consists of all complex numbers c for which the following iterative equation does not diverge to infinity:
\[z_{n+1} = z_n^2 + c\]
where:
- \(z_0 = 0\)
- \(c\) is a complex number
- If \(|z_n|\) remains bounded (does not go to infinity) after many iterations, then \(c\) is in the Mandelbrot set.
Visualization of the Mandelbrot Set
- The set is typically drawn on the complex plane, where the x-axis represents the real part and the y-axis represents the imaginary part of \(c\) .
- Points inside the Mandelbrot set are colored black.
- Points outside the set are colored based on how quickly they escape to infinity.

A character-based program was used to compute a basic
representation of the Mandelbrot Set for the first published
image of the set in 1978 by Robert W. Brooks and Peter Matelski.
With modern computers we can easily generate much more detailed images of the Mandelbrot Set. The following C++ program generates a PGM (Portable Gray Map) format image of the Mandelbrot Set. PGM images can be viewed and saved in other formats using:
- Linux: Gnome ImageViewer (free), GIMP (free), ImageMagick (free)
- MacOS: Apple Preview (free), Acorn (paid), GIMP (free), ImageMagick (free)
- Windows: IrfanView (free), GIMP (free), ImageMagick (free)

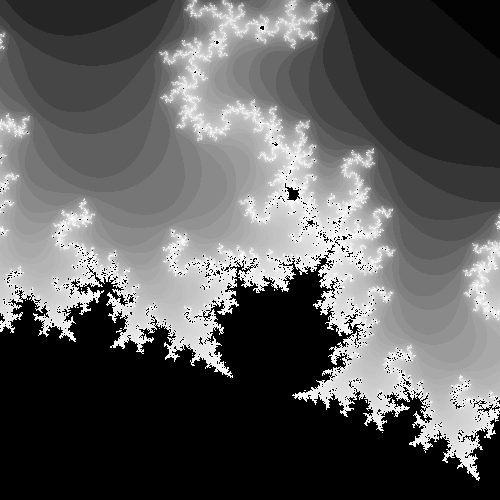
Image of The Mandelbrot Set computed using./mandelbrot -0.75 0 1.5 -s 1000 -m 2000
See Simple Mandelbrot Set Program for details on the mandelbrot.cpp program.
As you zoom in closer and closer with smaller values of radius when generating images, you will need to increase the max_iterations value. This is because lower values will cause pixels near the boundary of the set to be falsely considered in the set (colored black). Values very near the boundary of the set are the ones most likely to need large numbers of iterations before they escape.

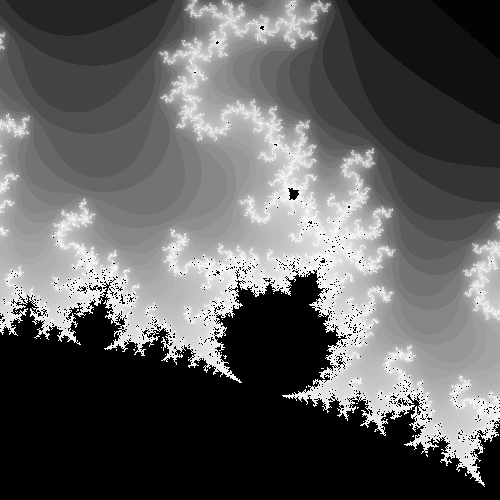
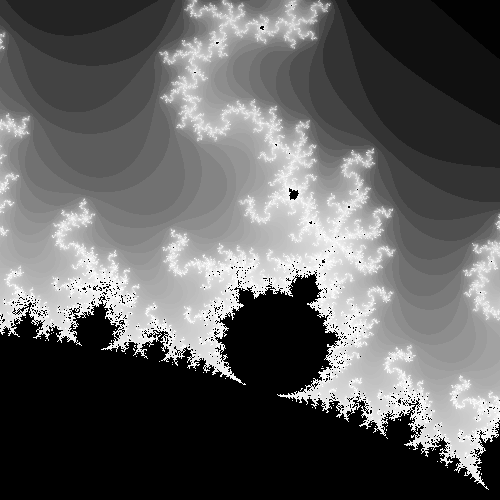

Images of x=-0.925 y=0.266 radius=0.05
with max iterations of 50, 100, 150, 200 and 300
As we increase the image size and iteration maximum the compute time increases. To take advantage of computers with multiple processors, we can divide the image into strips and compute the strips in parallel. The Mandelbrot_threaded.cpp program will create as many threads as there are CPUs on your system to be able to compute the image as fast as possible.
See Multi-Threaded Mandelbrot Set Program for details on the mandelbrot_threaded.cpp program.
Our program uses a histogram to more evenly distribute the gray levels. We can also use those gray levels to blend two colors or rotate through rainbow colors if we want to add color to our images.
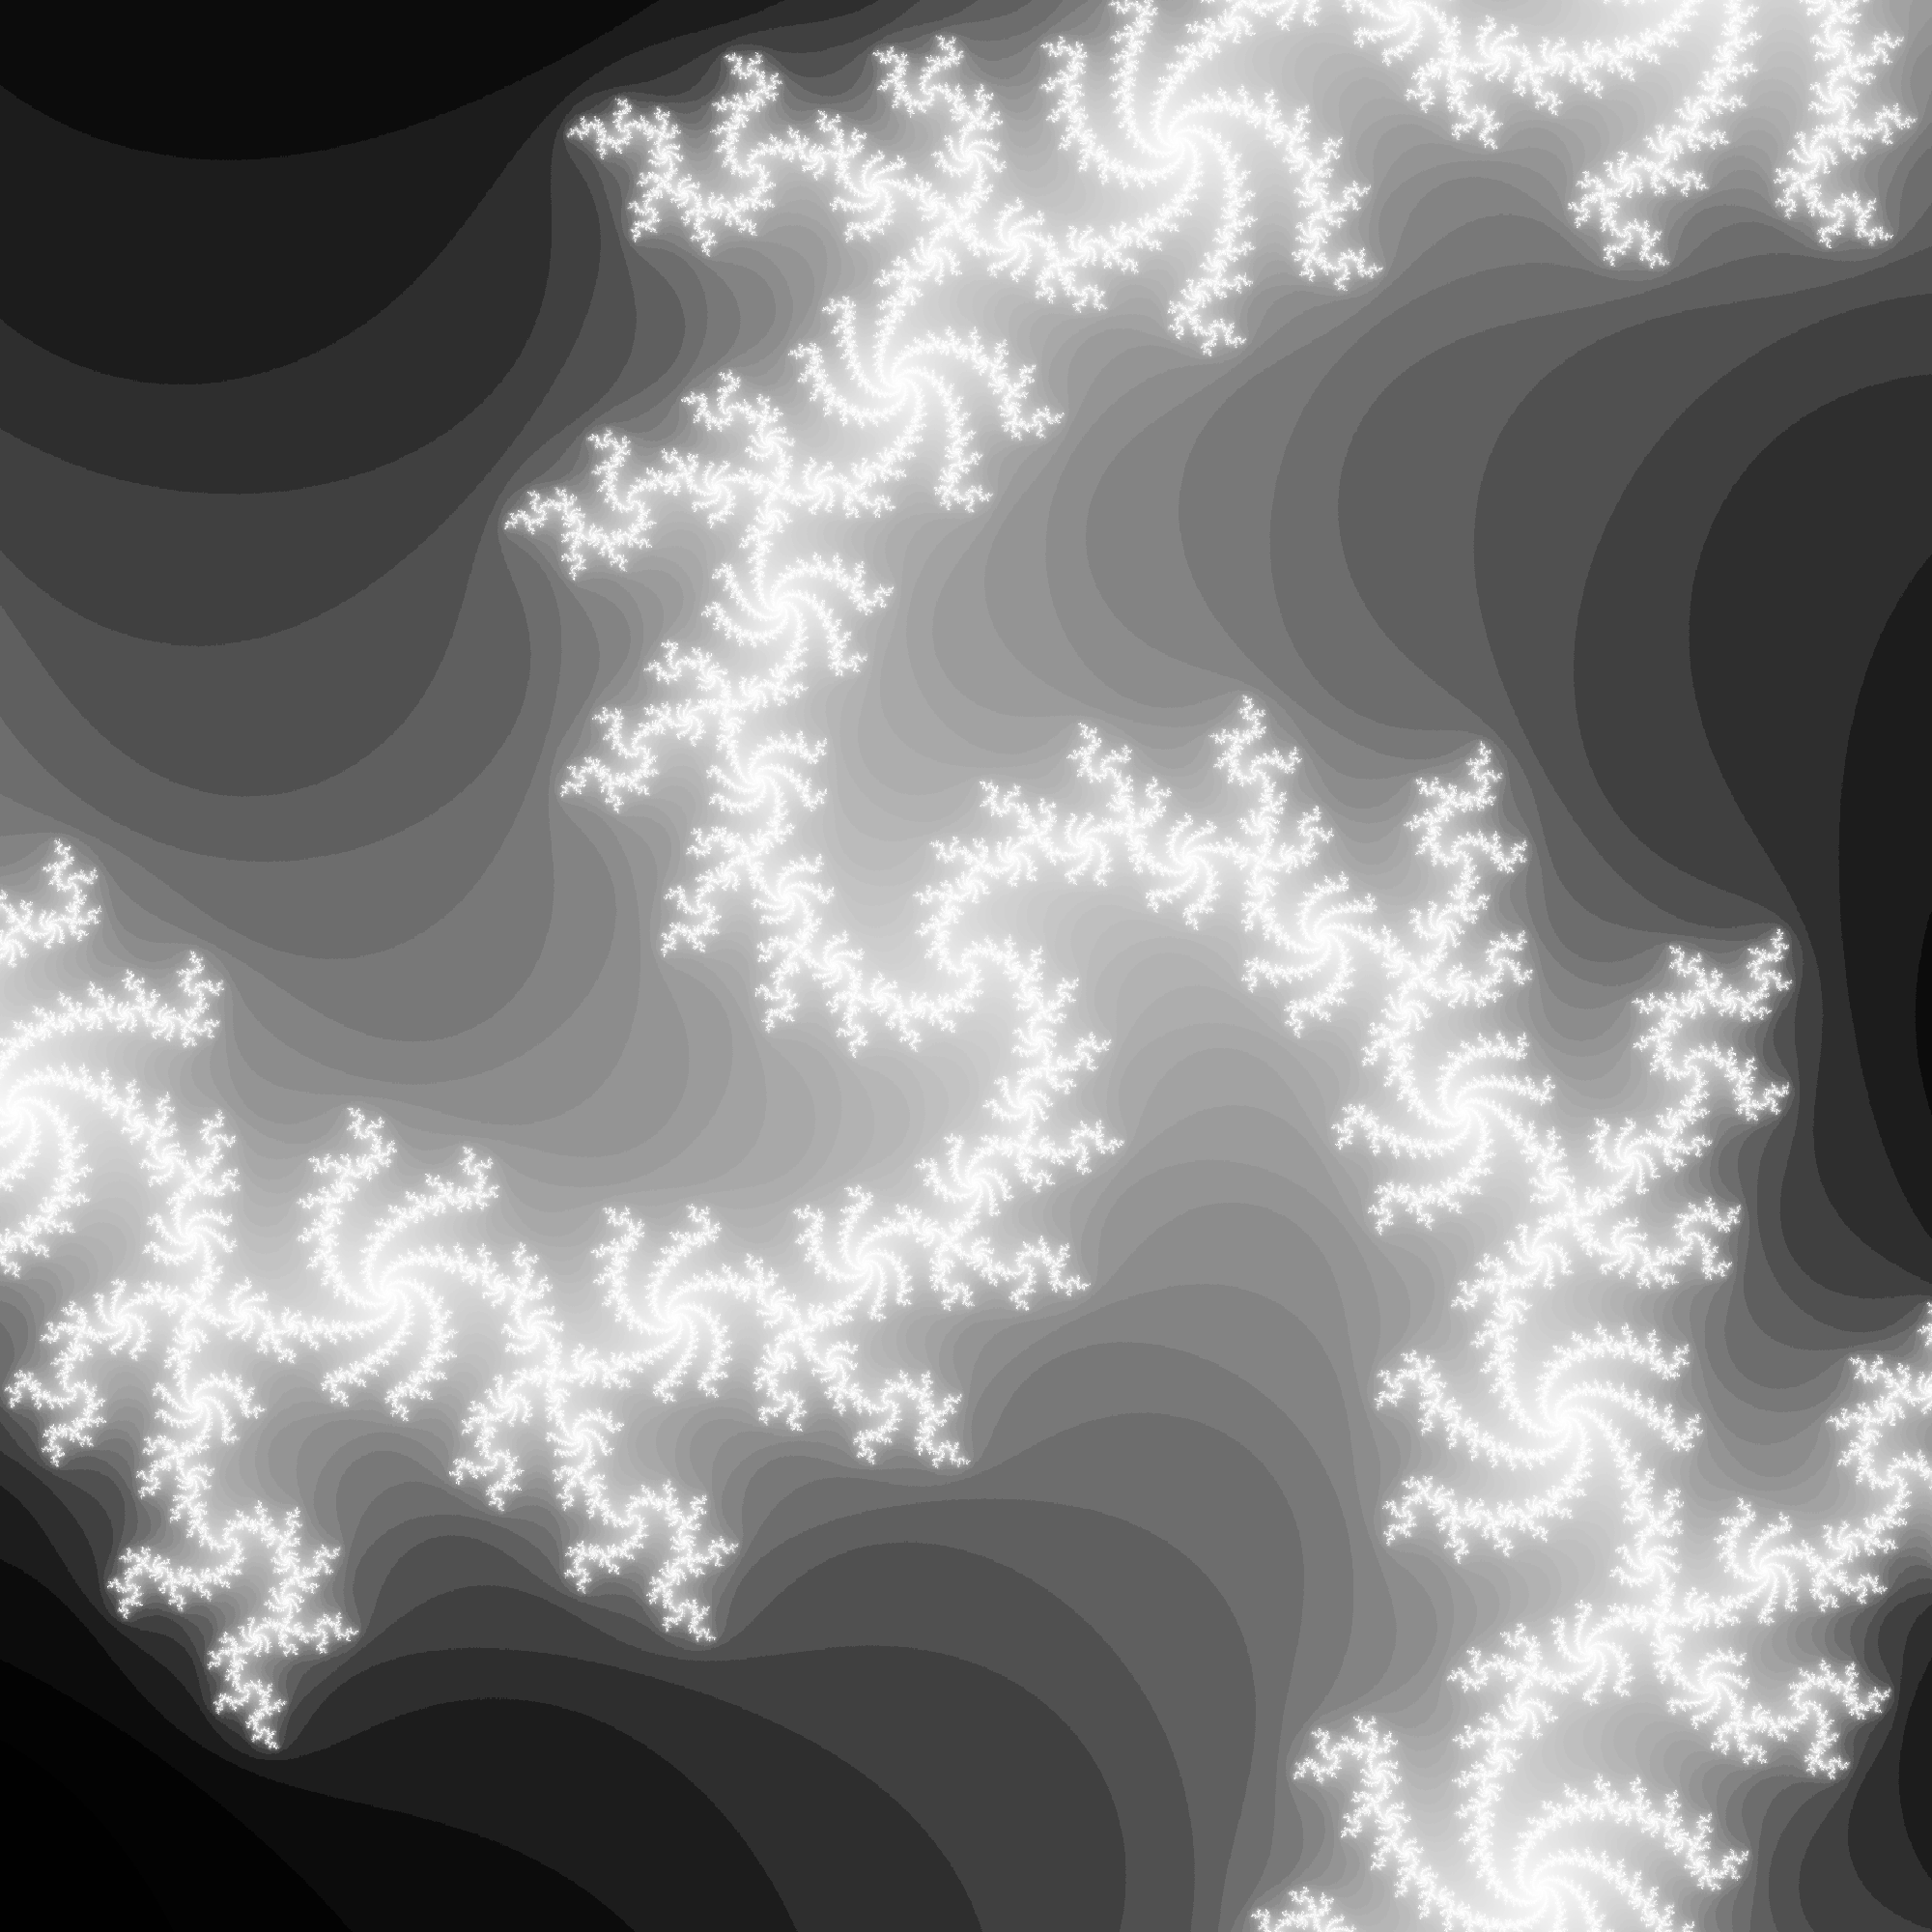


In the following program if you supply colors on the command line, the program will create an RGB PPM (Portable Pixel Map) file. In this color mode, there are two extra command line arguments that define the color to use for minimum and maximum escape counts. The colors are specified using hexadecimal #xxx or #xxxxxx format. If the colors are both shades of gray, the program will create a PGM (Portable Gray Map) file which are much smaller since they contain only one channel instead of the three that the PPM contains. By changing the constant MAX_PIXEL_LEVELS you can control whether 8-bits or 16-bits per color channel are used. Due to the discrete nature (integer) of the escape iterations, using 16-bit channels doesn't really smooth things out like you would imagine. For most applications 8-bits is sufficient. If you define USE_RAINBOW a rainbow coloration mode will be used instead of two colors. The rainbow mode doesn't really convey any more information or detail than grayscale. In my opinion, the multiple colors can distract from understanding the structure of the Mandelbrot Set.
See Multi-Threaded Mandelbrot Set Program for details on the mandelbrot_threaded_color.cpp program.
Using standard IEEE 754 64-bit floating-point types, as these programs do, we eventually encounter a limitation in rendering increasingly smaller views of the Mandelbrot Set. When the radius shrinks to around \(10^{-14}\), the once square pixels begin to stretch and distort. This distortion occurs because the precision of floating-point values is no longer sufficient to differentiate distinct x-values and y-values for adjacent pixels, causing them to appear elongated in the plot on the left below. The reason this occurs around \(10^{14}\) is due to the fact that IEEE 754 64-bit types only have about 15 decimal digits of accuracy.

0.0005697777730442394 0.7514647407619401945
1e-15 -s 500 -m 1000

0.0005697777730442394 0.7514647407619401945
1e-15 -s 500 -m 1000 -d 20
We can use higher-precision floating point types but usually at a cost of performance. x86-64 based CPUs support 80-bit extended floating point, with about 19 decimal digits of accuracy, in hardware. MacOS on Apple Silicon ARM CPUs do not have any hardware support for extended floating point. Using the Gnu MP multi-precision library we can implement software arbitrary precision floating point for any architecture. The image on the right above uses the same inputs as the one on the left but the program has been compiled to use high-precision floating point with approximately 50 significant digits.
The program below is a modified version of the mandelbrot_threaded program that uses hardware extended precision if available or software arbitrary precision using the Gnu MP (Multi-Precision) library if no hardware support is found.
See the Multi-Precision Mandelbrot Set Program for details on the mandelbrot_threaded_color_mp.cpp program.
You can find a gallery of images that I computed using these programs at https://www.lesh.cloud/mandelbrot/
You can find an exploration of one point on the Mandelbrot Set at ever increasing magnifications that illustrates the use of the multi-precision version of the program at https://www.lesh.cloud/mandelbrot/deep_mandelbrot/